In early February 2017, the Wilcox household purchased its first set of Katris blocks for our kitties Cali and Neko. The modular cat tree can be assembled in numerous configurations. According to the company: “Each block is made from over 200 sheets of heavy-duty paperboard and can withstand more than 300 pounds of weight”. The upper layer is ready for paw scratching. For such value, we purchased three more sets.
Few days ago, I considered buying more—that is until seeing how shockingly higher is the selling price: $395.95, which is a 65 percent increase over our first Katris kit; 97 percent more than the second (July 2017); 90 percent increase over the third (October 2017); and 72 percent more than the fourth (December 2018). How’s that for an indicator of inflationary pricing?
But those numbers reflect selling prices, not necessarily what we paid. Credit card companies and retailers offered more perks before the world went mentally ill over SARS-CoV-2 (severe acute respiratory syndrome Coronavirus 2)/COVID-19 and the U.S. Fed started jacking up interest rates. For example, applying rewards points brought our second kit down to $149.26, making the current price 165 percent more. A 20-percent Amex discount brought the third to $166.08. I rightly remember paying less, which makes current pricing seem so much higher.
So our cat math sees inflationary-driven price increases two ways: How much more is the selling price and how much less is the choice of discounts and perks.
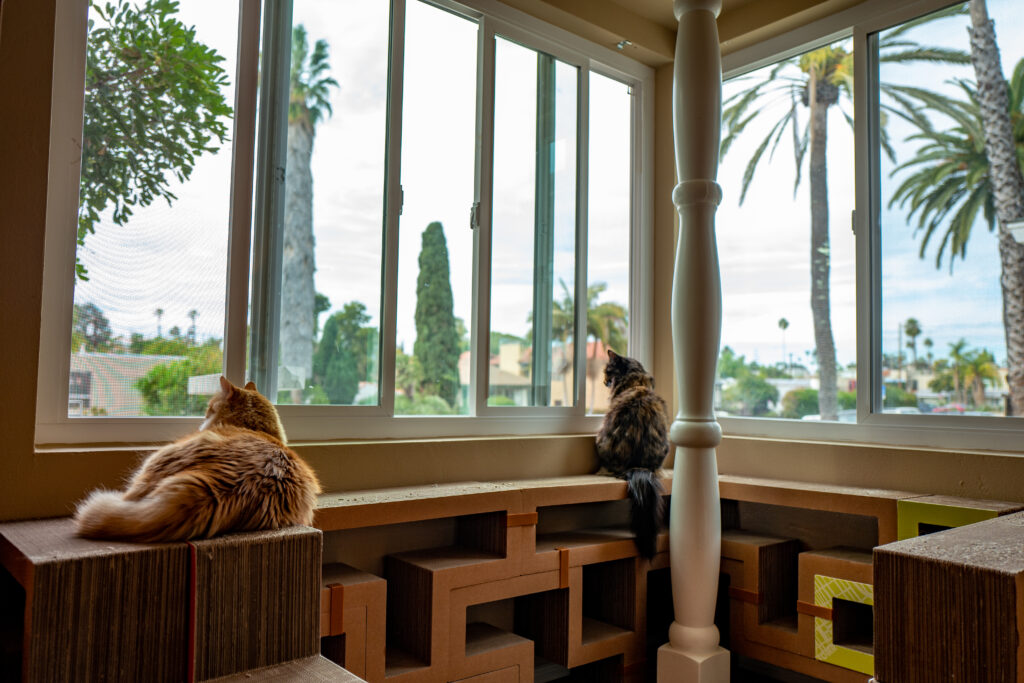
The Featured Image shows the living room windows, where three sets of Katris blocks provide pathway for Cali and Neko. I used Leica Q on Nov. 15, 2017, but the configuration remains the same in 2023. Vitals: f/2.8, ISO 100, 1/200 sec, 28mm; 1:21 p.m. PST.